
Your GA4 says 842 sessions last month. You have no idea if that is good or bad.
Someone installed it eighteen months ago. You check it every few weeks, scroll past a cluster of graphs that make you feel vaguely informed, and close the tab. Someone mentioned Hotjar recently and you are now wondering whether you need that too. And there is Search Console, apparently that is different from GA4. And Looker Studio. And Semrush. And the list keeps getting longer.
Here is the short answer: you need four tools, two of which cost nothing. Everything else is optional, and most of it you will never genuinely use.
This post covers those four tools. What each one tells you, what the others cannot, and what "good" actually looks like for a business running somewhere between 500 and 2,000 sessions a month.
Why more tools is not the answer
There is a pattern that plays out constantly with UK small businesses. Someone installs GA4, sets up Meta Pixel, gets sold a Semrush subscription, starts a Hotjar trial, and connects the ads account. Six months later they have five dashboards. Nobody opens more than one of them.
More data is not the same as better decisions. It is often the opposite.
The real question is not "what should I be measuring?" It is "what decisions should this data help me make?" If you cannot answer that question, adding another platform will not help. It will just give you more tabs to feel guilty about not reading.
Most UK small businesses need four tools to cover everything that actually matters: where traffic comes from, what visitors do once they arrive, how the business appears in search before anyone clicks, and how to see all of that in one place without switching between platforms every time. Everything beyond those four is optional, and the right moment to add it is when you have a specific question the core stack cannot answer.
Set up the foundation first. Use it for a few months. Then decide what is missing.
GA4: what it tells you (and the three reports that actually matter)
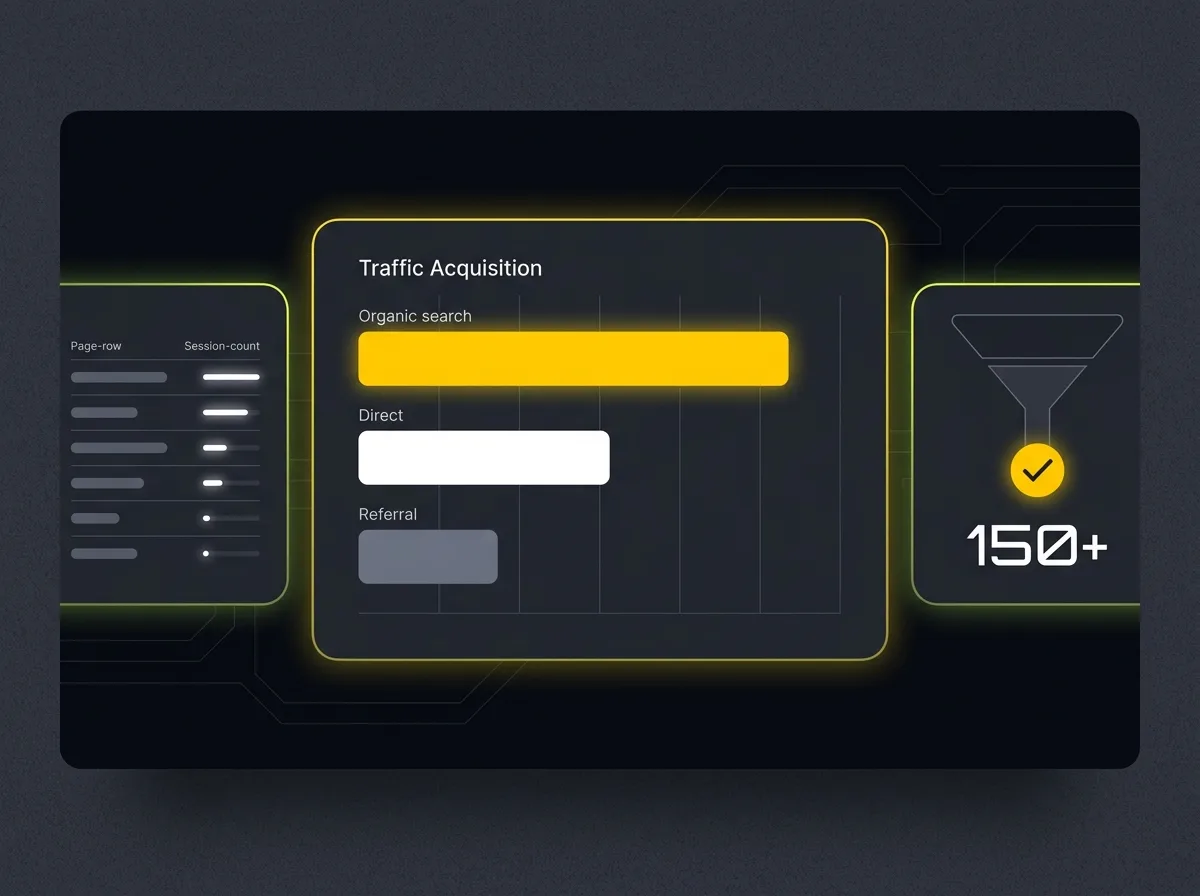
Google Analytics 4 is the foundation. It tells you who is visiting your website, where they came from, what they looked at, and whether they took any meaningful action. If you have a website and no analytics running on it, GA4 is the first thing to install. It is free.
A quick note on history. GA4 replaced the old Universal Analytics in July 2023. If your developer "set up Google Analytics" before that date, there is a reasonable chance they installed Universal Analytics, which stopped collecting data when Google switched it off. Worth checking.
The GA4 interface can feel overwhelming at first glance, but in practice most UK small businesses only need three reports.
Traffic Acquisition. Found under Reports, then Acquisition, this shows where your visitors came from: organic search, direct, referral, paid, email, or social. It is the most important starting point because it tells you which of your marketing activities is actually driving people to your site. If 80% of your traffic is organic search and you are about to cut your SEO budget, this report should give you pause.
Pages and Screens. This shows which pages people visited, how long they spent on each one, and how often they came back. If your homepage accounts for 60% of your sessions but your most valuable service page gets 2%, that gap is important. It tells you where people go once they arrive, not just that they arrived at all.
Conversions. This is the one most businesses skip setting up. It is also the most valuable of the three. A conversion is any action that matters to the business: a form submission, a phone number click, an email link click, a purchase. Without this configured, GA4 is like a shop that counts footfall but never tracks who bought anything.
Consider a business running 1,200 sessions a month that has never set up a single conversion goal. They have no idea that 90% of that traffic is landing on an old blog post and leaving immediately. The enquiries are actually coming from a small number of people landing on a specific service page via a very specific search term. Without Conversions set up, they would never know. They might keep investing in traffic when the real problem is what happens once traffic arrives. If conversion tracking feeds into a broader B2B marketing funnel, getting that setup right from the start is what makes the data usable.
A note on engagement rate. The old Universal Analytics measured bounce rate: the percentage of single-page visits. GA4 replaced that with engagement rate, which counts sessions where the visitor spent more than ten seconds on the page, viewed two or more pages, or triggered a conversion event. A GA4 engagement rate above 55% is generally healthy. Below 40% on a core landing page is worth investigating.
GA4 and UK GDPR. Worth a brief mention here. GA4's default configuration collects data in ways that may require user consent under UK GDPR and the Privacy and Electronic Communications Regulations. The ICO's guidance on analytics cookies is the authoritative starting point for UK businesses. In practice, most implement a consent banner and configure GA4's consent mode, which adjusts what data is collected based on what a visitor accepts. Your web developer should have this in place. If you are not sure, it is worth checking before anything else.
Google Search Console: the picture before the click
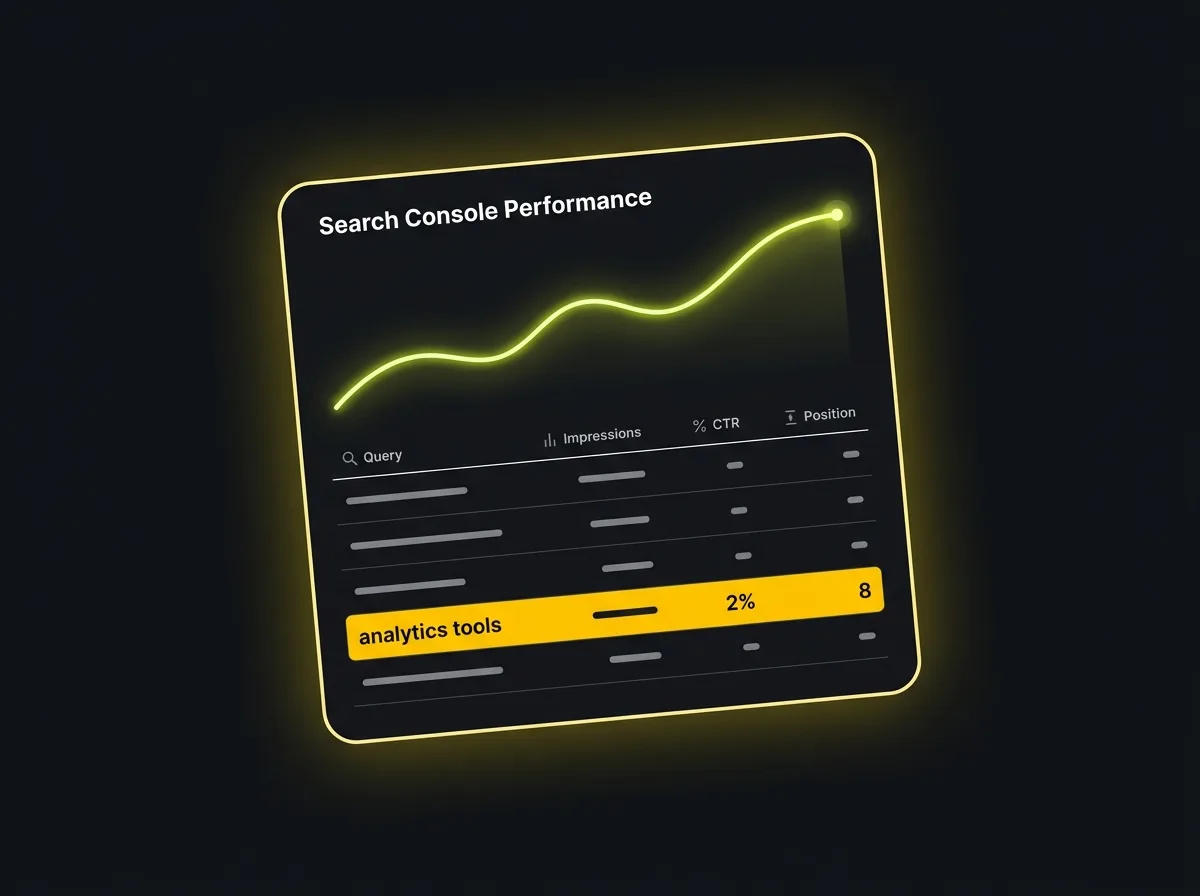
GA4 tells you what happens after someone arrives on your website. Google Search Console tells you what happens in the moments before they click.
Specifically, it shows how your pages appear in Google search results, which search queries are causing your pages to show up, how many times those results were seen (impressions), what position you were ranking in, and how many people actually clicked through. None of that pre-click data exists in GA4.
The complementary relationship between the two tools is the thing most people miss. Suppose GA4 is showing 600 organic visits last month. Sounds reasonable. Then you open Search Console and see your pages appeared in search results 40,000 times. That means 39,400 people saw your listing in Google and chose not to click. Entirely different picture. The pages may be ranking. They are just not compelling anyone to visit. That is a fixable problem, and you would never know it existed from GA4 alone.
The two most useful Search Console reports are Performance and Coverage.
Performance shows queries, pages, clicks, impressions, click-through rate, and average position. Sort by impressions to find pages that are appearing frequently in Google results but attracting very few clicks. A page ranking in position 4 with a 2% click-through rate when similar pages get 8-10% is telling you that the title or meta description is not doing its job. Alternatively, sort by average position to find pages sitting between positions 6 and 15. Those are pages close enough to the top to move with a bit of focused work, and they often represent faster wins than trying to build new content from scratch.
Coverage shows which of your pages Google has indexed and flags any problems. A page Google cannot read cannot rank. If important service pages are appearing as excluded or errored, that is the first thing to fix.
Linking Search Console to GA4. You can connect the two tools so that Search Console data appears inside GA4, giving you a more complete view in one place. Google's official instructions for linking the two take about five minutes to follow. Worth doing. Once connected, the Search Console reports inside GA4 let you see which search queries drove traffic to which pages, and where impressions are outrunning clicks.
If you want to act on what Search Console is showing you, that is precisely what an SEO agency does in practice: finding which pages are close to ranking, identifying queries the site should be appearing for but is not, and building the signals needed to move a position 8 result to position 3. The data is in Search Console. The strategy is what to do about it.
Looker Studio: where the picture comes together
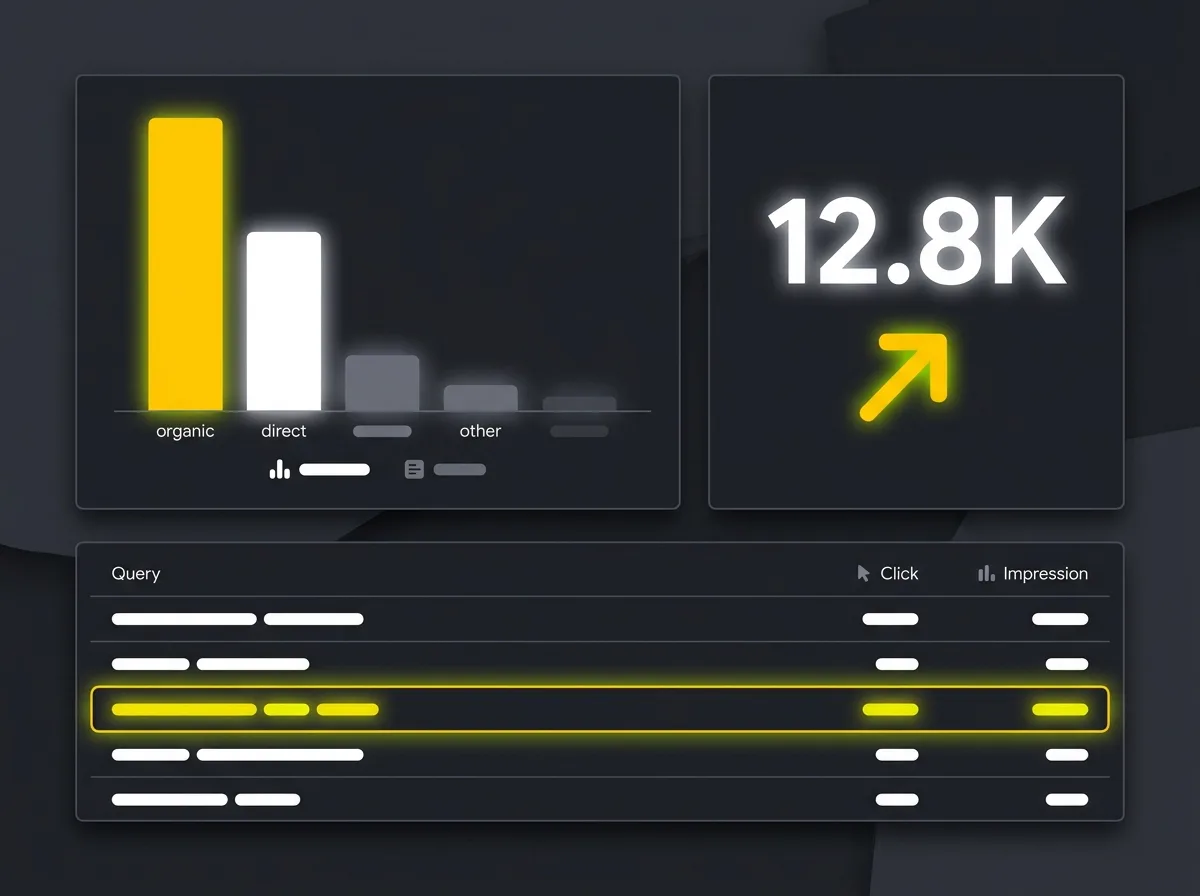
Most small businesses end up logging into two or three separate platforms every time they want to check how their marketing is performing. GA4 is one tab. Search Console is another. If paid search is running, Google Ads is a third. Every review becomes a tab-switching exercise, and after a while, the switching stops happening entirely.
Looker Studio removes that friction.
It is Google's free dashboard tool. It connects to GA4, Search Console, Google Ads, and dozens of other data sources, and lets you build a single view of everything that matters in one place. No switching between platforms. No re-logging in. One link, the numbers you actually care about.
A basic Looker Studio dashboard for a UK small business typically shows: sessions by channel for the last 30 days, conversions by channel, top organic queries from Search Console, and the pages driving the most engagement. That is all most businesses need to understand whether this month is performing better or worse than last, and which channel is pulling its weight.
The other thing Looker Studio fixes is stakeholder reporting. If you have a marketing manager, an external agency, or a leadership team who wants a monthly performance update, Looker Studio produces something they can read without knowing how to navigate GA4. You share a link. They see the numbers. That is the end of the "can you send me the stats" email.
Free. No catch.
When to add a fourth tool, and what problem it should solve
The guidance on adding a fourth tool is simple: do not add one until you are genuinely using the first three. A Hotjar account you log into twice a year is not a marketing analytics tool. It is a monthly subscription that makes you feel like you have your data covered.
When you do hit a real limit with the core stack, the right question is: what specific question am I trying to answer that these three tools cannot? The tool follows the question. The tool never comes first.
Three scenarios where a fourth tool earns its place:
-
"I want to understand where on my pages visitors are dropping off." Microsoft Clarity answers this question and it is completely free. It gives you session recordings, heatmaps, and click maps showing where people interact with your pages and where they abandon. Hotjar does the same job and is worth considering if you want more granular features, but Clarity handles the core question without any cost. For most UK small businesses, it is more than sufficient.
-
"I am running paid search and need to connect ad spend to outcomes." Google Ads reporting is built into your Ads account already. Connect it to Looker Studio and your paid and organic data sit in the same view. You do not need to buy anything extra. If Meta campaigns are also running, Meta Business Suite has its own reporting. For most businesses at this scale, the data does not need to live anywhere else.
-
"Enquiries come in by phone and I need to know which channel drove the call." This is where the free stack genuinely runs out. GA4 can track a click on a phone number link, but it cannot tell you whether the actual conversation that followed led to a sale. Call tracking tools like CallRail or Infinity assign different phone numbers to different traffic sources, so you can see that the enquiry coming from a Google search converted at a different rate to the one from a referral. For service businesses that rely heavily on inbound calls, this is often one of the most valuable additions to the stack.
One question, one tool. If you cannot articulate the question the tool answers, you do not need it yet.
What a proper marketing dashboard actually looks like
There is a significant gap between having access to data and having a clear view of it.
Most businesses using GA4 and Search Console separately never connect the full picture. They check sessions. They note the number went up or down. They close the tab. The question "which traffic source is actually driving enquiries?" is never cleanly answered because the data lives in different places, and pulling it together takes ten minutes they never seem to have.
A properly connected dashboard removes that overhead entirely.
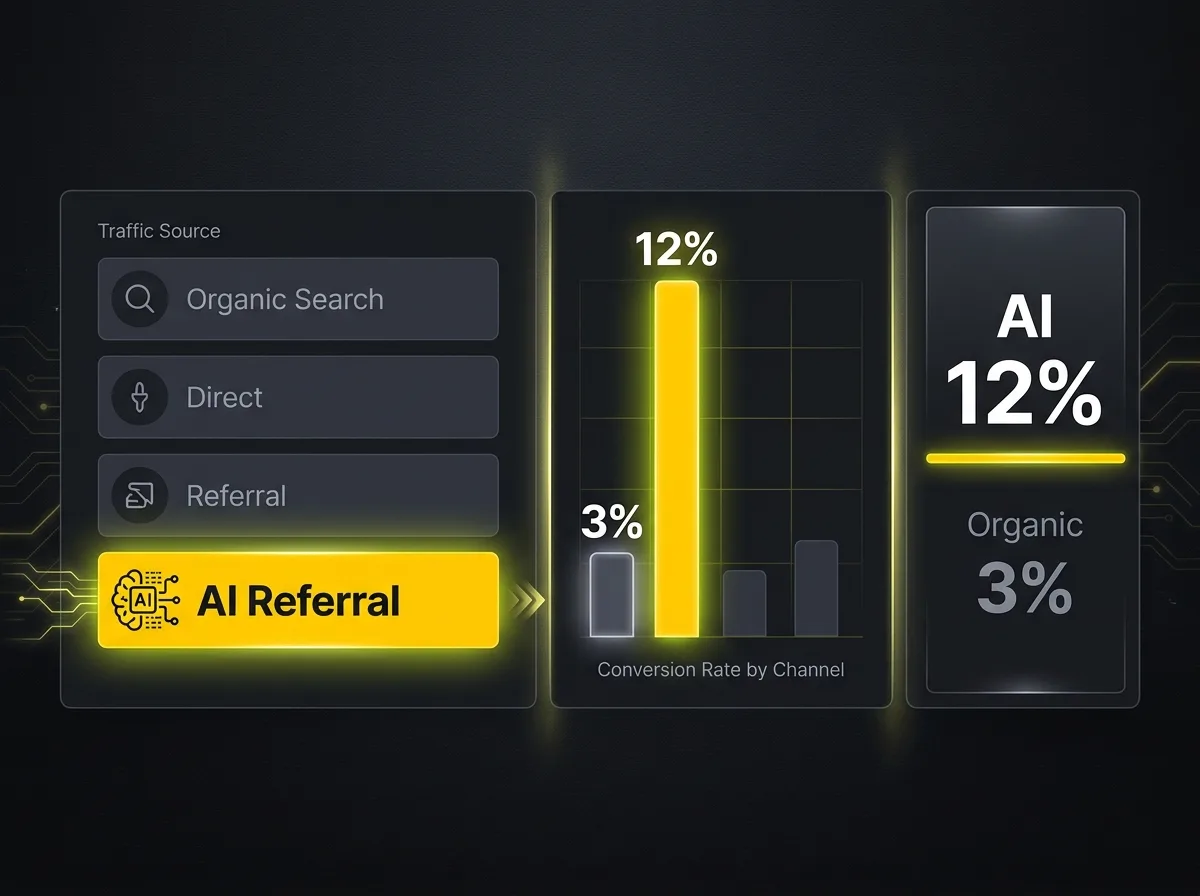
What we build for clients at Creative Tweed is a single view pulling together the figures that drive real decisions: conversions and conversion rate by traffic source, conversion rate by keyword, conversion rate by page, and AI traffic broken down by referring platform. When a client opens that view, they can see in seconds that their AI-referred traffic is converting at 12-15% while their organic search traffic is converting at around 3-4%. AI search traffic converts differently because people arriving from a ChatGPT or Perplexity recommendation are already closer to a decision. Knowing that changes where you invest.
The point is not the software. It is the clarity.
A business owner should be able to open one view and answer three questions without clicking anything: where is my traffic coming from, which sources are converting, and which pages are doing the work? If your current setup cannot answer those three questions in under a minute, the data is not working hard enough.
This is what we configure for clients as part of a search visibility and traffic programme. Not a separate product or an add-on. Built into how the work is reported from day one.
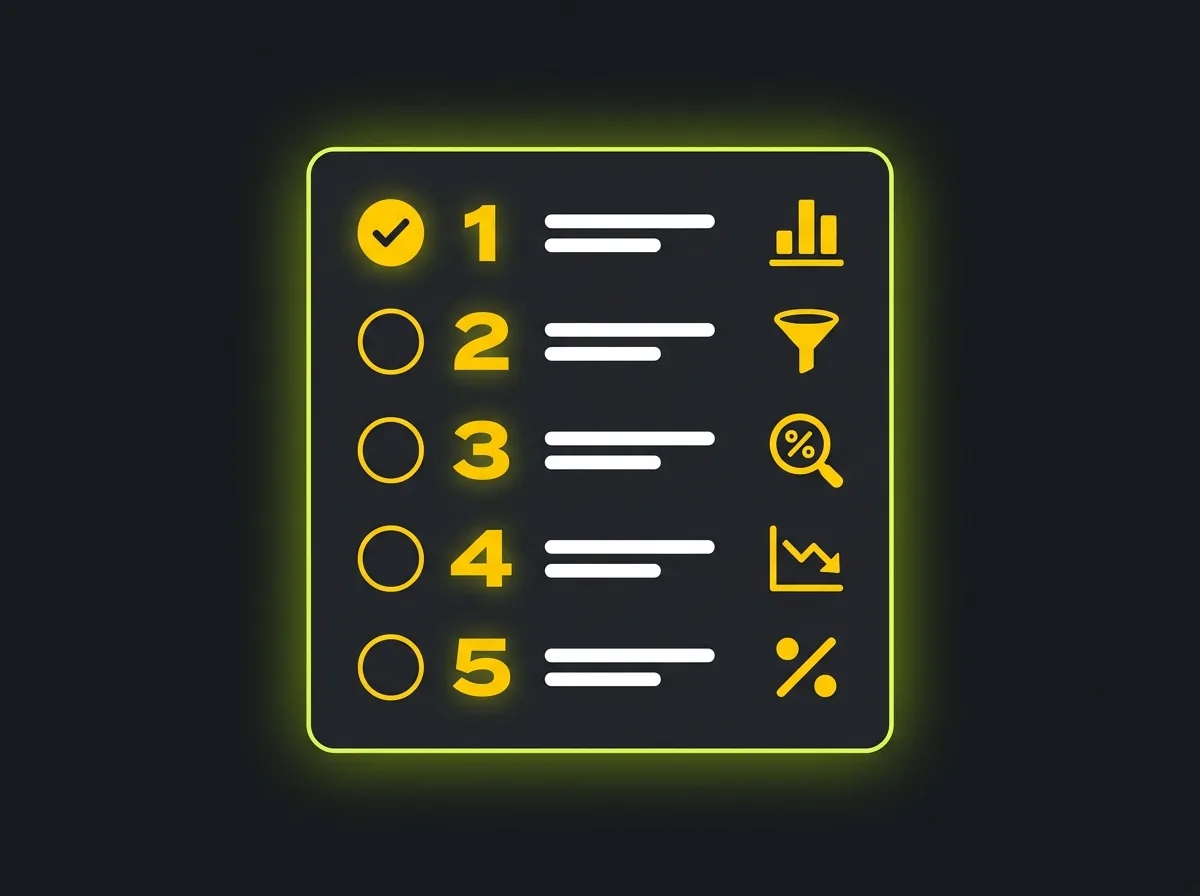
Reading what the data is telling you: five monthly questions
The tool is not the point. The question is.
Every analytics platform exists to help you make better decisions. The businesses that genuinely get value from their data are not always the ones with the most sophisticated setup. They are the ones asking the same five or six questions every month and tracking whether the answers are improving. A monthly review ritual beats daily dashboard-checking every time.
Here are the five questions worth asking.
1. Where is my traffic coming from, and did that mix change?
Pull up Traffic Acquisition in GA4 and compare last month to the month before. If organic search has dropped from 60% to 40% of total sessions, something has changed and it is worth understanding what. If direct traffic has spiked, it may be an offline campaign or some press coverage. The mix tells you which channels are working and reveals which ones are declining quietly while the overall number stays flat.
2. Which pages drove the most conversions?
This is the question that changes how most businesses think about their content. The highest-converting page is often not the homepage, not the services page, and not the page the team spent the most time on. It is frequently a specific blog post or a service subpage that nobody thought to prioritise. Once you know which pages convert, you know which pages to protect, improve, and direct traffic towards.
3. Are there queries where my click-through rate is unusually low?
Open Search Console and sort the Performance tab by impressions. Look for pages appearing thousands of times in search results with a click-through rate below 2%. Those pages are visible in Google, which is the hard part. They are simply not compelling anyone to click. The fix is usually the page title, the meta description, or both. It is often the fastest improvement available.
4. Which pages lost clicks or impressions compared to last month?
Sort by change in clicks or impressions and look at what has declined. A page losing ground month-on-month is worth investigating. It might be a seasonal shift. It might be a competitor who published something stronger on the same topic. It might be a technical issue that has reduced the page's visibility without triggering any obvious error. All three are worth knowing. None of them appear in GA4.
5. Is my overall conversion rate stable?
Total conversions divided by total sessions, compared to last month. If sessions went up 20% but conversions stayed flat, your conversion rate fell. If sessions held steady but conversions rose, something is working and it is worth understanding what drove it. This single ratio tells you more about the health of your marketing than any headline traffic number.
A note on AI search traffic. GA4 does not yet have a dedicated AI search channel the way it has an organic search channel. Traffic arriving from AI tools tends to surface under Referral in the Acquisition reports, with the referring domain visible. Perplexity traffic typically appears as perplexity.ai. Traffic from ChatGPT-linked references shows up similarly. The picture is imperfect and will change as these platforms evolve. The practical habit is to scan your referral source list regularly for unfamiliar but recognisable platform names. You may already be receiving AI-referred traffic and not know it.
Frequently asked questions about marketing analytics tools
Is GA4 free?
Yes, completely. Google Analytics 4 is free to install and use. You connect it to your website via a tracking code or a tag management system, and it begins collecting data immediately. There is a paid enterprise version called Google Analytics 360, designed for very large sites with substantial traffic volumes, but for the vast majority of UK small and medium businesses the free version is more than enough.
What does Google Search Console tell you that GA4 doesn't?
GA4 tracks what happens after a visitor arrives on your website. Search Console captures what happens in Google before that visit takes place. That includes which search queries triggered your pages to appear, how many times your pages appeared in results (impressions), what position you ranked in, and how many people clicked. GA4 has no visibility of any of that pre-arrival data. The two tools are designed to be used together, not as alternatives.
Do I need to pay for marketing analytics tools?
For most UK small businesses, no. GA4, Google Search Console, and Looker Studio are all free. Microsoft Clarity, which provides session recordings and heatmaps, is also free. You can build a complete, genuinely useful analytics setup at zero cost. Paid tools like Semrush, Ahrefs, or Hotjar's paid tiers add value, but for specific purposes: competitive keyword research, backlink analysis, advanced behavioural analytics. Start with the free stack. Add paid tools only when you can articulate the question they answer that the free tools cannot.
What is Looker Studio?
Looker Studio, previously called Google Data Studio, is Google's free dashboard and reporting tool. It connects to GA4, Google Search Console, Google Ads, and dozens of other sources, letting you pull all your marketing data into a single, customisable view. Instead of logging into separate platforms every time you want to check performance, everything is in one place. You can share a live link with anyone so stakeholder reporting becomes a link and not a spreadsheet.
How do I track phone call enquiries in my analytics?
GA4 can record when someone clicks a phone number link on your website, but it cannot tell you whether the call that followed led to an enquiry or a sale. If phone calls are a significant part of how your business generates leads, a call tracking tool is worth considering. Tools like CallRail or Infinity assign different phone numbers to different traffic sources, letting you see which channels drive calls and how those calls convert. It is a fourth-tool addition for businesses where inbound phone enquiries matter more than web form submissions.
The four tools, plainly
GA4 tells you who visited and what they did. Search Console shows how you appeared in Google before they arrived. Looker Studio connects both into a view you can actually use. A carefully chosen fourth tool answers the one specific question the other three cannot.
That is the complete stack. Two of those tools cost absolutely nothing.
If GA4 is showing you sessions but you are not sure whether that traffic represents a genuine opportunity or a ceiling, the Traffic Projection Report shows what a properly run programme could unlock, based on your actual keyword landscape and what competitors in your space are already ranking for.
It takes about five minutes. The report does the work.
Free resource: Traffic Projection Report
Find out what your organic search traffic could look like with the right strategy behind it. We map your current keyword landscape, model realistic traffic outcomes, and show you where the genuine opportunity sits for your business.